9 Personalized Video Examples to Inspire You
In this article, explore 9 carefully selected Personalized Video Examples from Retail, Insurance, Travel, and Hospitality enterprises. Each demonstrates how tailored videos boost loyalty, streamline customer onboarding, and drive customer retention at scale.


Seen heads to Retail Technology Show 2026
Seen.io exhibits at Retail Technology Show 2026, stand Z35, at ExCeL London on 22-23 April. Come meet us to see how retailers including Shell and Nespresso use personalised video to drive engagement, conversion, and loyalty.
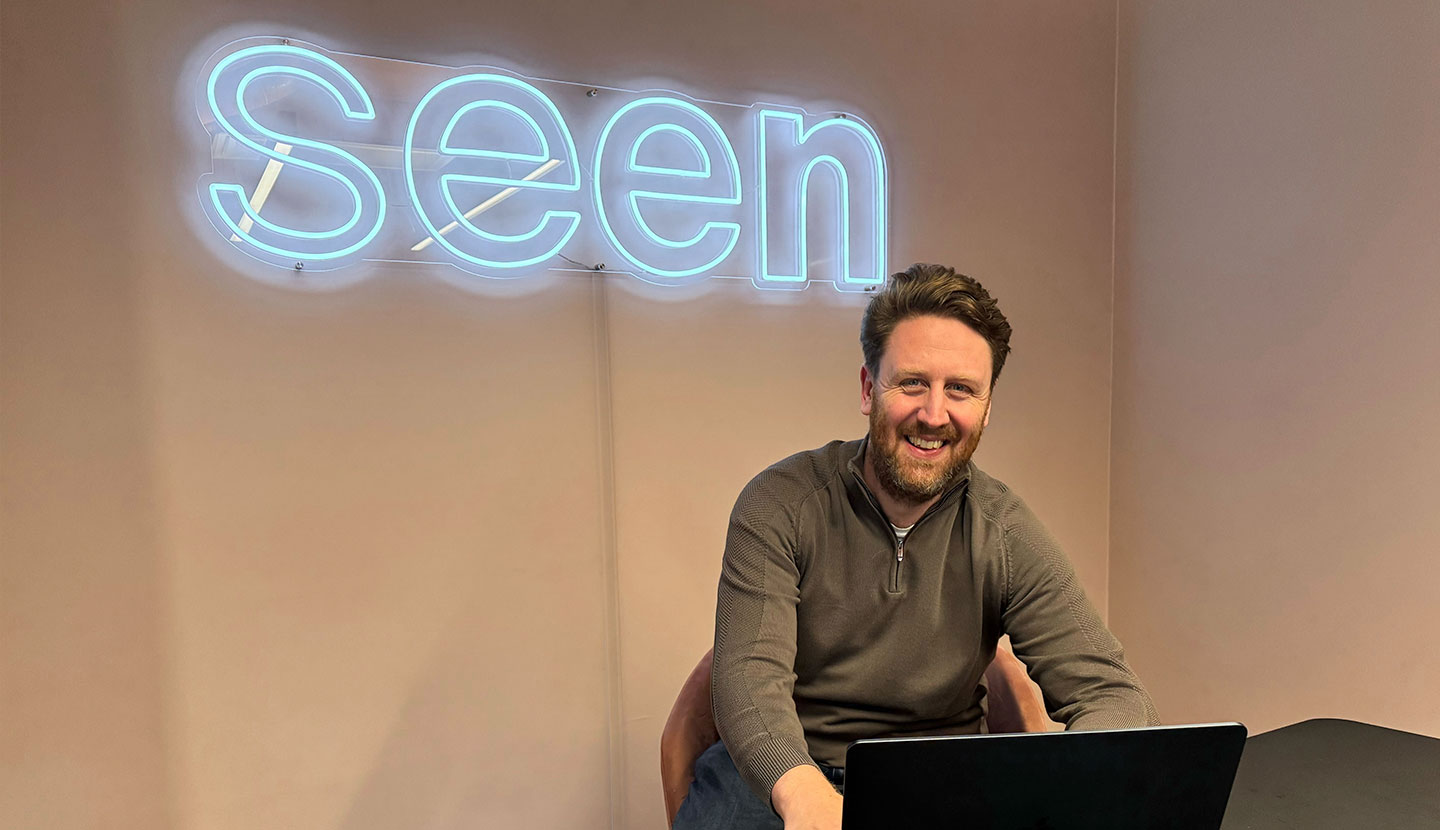
Seen.io appoints Christopher Osborne as VP of Global Sales
Seen.io is doubling down on its growth in the UK and beyond with the appointment of Christopher Osborne as VP of Global Sales. Osborne will lead Seen.io’s global revenue strategy and the expansion of its commercial operations, as the company continues to scale in one of its strongest growth regions.
9 Personalized Video Examples to Inspire You
In this article, explore 9 carefully selected Personalized Video Examples from Retail, Insurance, Travel, and Hospitality enterprises. Each demonstrates how tailored videos boost loyalty, streamline customer onboarding, and drive customer retention at scale.

Seen Now ISO 27001 & 27701 Certified!
These globally recognized certifications highlight our dedication to safeguarding your data and respecting your privacy.

How to Upsell Without Alienating Fans
Explore the risks of fan engagement and how to navigate them without compromising your brand.

From Content Clutter to Clear Customer Journeys
Unlock the secrets of video content that enhances customer journeys without risking overload.

Messages That Resonate: Personalizing Fan Experiences with Video
Discover how personalized videos forge deeper fan connections and boost engagement.

Igniting passion through creative sports fan engagement strategies
The relationship between sports brands and their fans is undeniably significant, going beyond the boundaries of mere entertainment. In this article, we'll dive into the benefits that arise from fostering strong fan engagement.

Hearing your name in a video: The psychological impact and benefits
Our names are more than a simple form of identification. In this article, we will take a closer look at what happens when hearing one's own name and how it influences our perception and memory.

Views to Victory: The Journey of Fan Engagement Via Video Analytics
Unlock fan loyalty with video analytics—transform views into victories and boost engagement.
🤷
No results found.
Please try different keywords.
Experience the magic of data driven video first hand.
